The final click is sent, the campaign data is compiled, yet the resulting report lands on the boardroom table with a quiet thud. For many marketing leaders, the greatest challenge isn’t generating results-it’s orchestrating a cacophony of metrics into a clear narrative of commercial success. This is where a strategic marketing report for stakeholders template becomes less of a document and more of a conductor’s baton, transforming disparate notes of data into a powerful business case that commands attention and proves marketing’s contribution to the bottom line.
Forget spending hours wrestling with spreadsheets only to present a story that gets lost in translation. We’re providing more than just a template; we’re offering a strategic framework to help you master the art of stakeholder reporting. You will learn to amplify your wins, contextualise your challenges, and harmonise every data point with the company’s overarching vision. Prepare to craft a report that not only gets read but gets praised, securing the budget and strategic alignment your team deserves.
Key Takeaways
- Elevate your reporting by transforming raw data into a compelling narrative that clearly demonstrates marketing’s contribution to business growth.
- Learn how to tailor your reports for different audiences, focusing on high-level growth for the CEO and cost-efficiency metrics like CAC for the CFO.
- Implement a professional marketing report for stakeholders template designed to highlight the high-impact KPIs that truly resonate with the board, such as ROAS and LTV.
- Discover a strategic framework to align your reporting with core business objectives by defining a ‘North Star’ metric that guides your entire strategy.
Understanding the Stakeholder Symphony: Why Your Marketing Report Needs a Narrative
Your marketing report is far more than a collection of charts and percentages; it is a strategic performance. It’s the conductor’s score that translates the complex harmony of your marketing activities-from SEO campaigns to social media engagement-into the clear, resonant language of business value. Too often, marketers present a cacophony of data without a story. A 20% increase in clicks means nothing to a CEO without the crucial ‘so what?’. The answer lies in demonstrating how those clicks orchestrated a measurable rise in qualified leads and, ultimately, revenue.
As we move towards 2026, the era of the static, data-heavy PDF is fading. The future of reporting is dynamic, insightful, and narrative-driven. A well-composed marketing report for stakeholders template isn’t just about looking back; it’s a powerful tool for building trust, justifying budgets, and securing the resources needed to amplify your brand’s voice in the years to come.
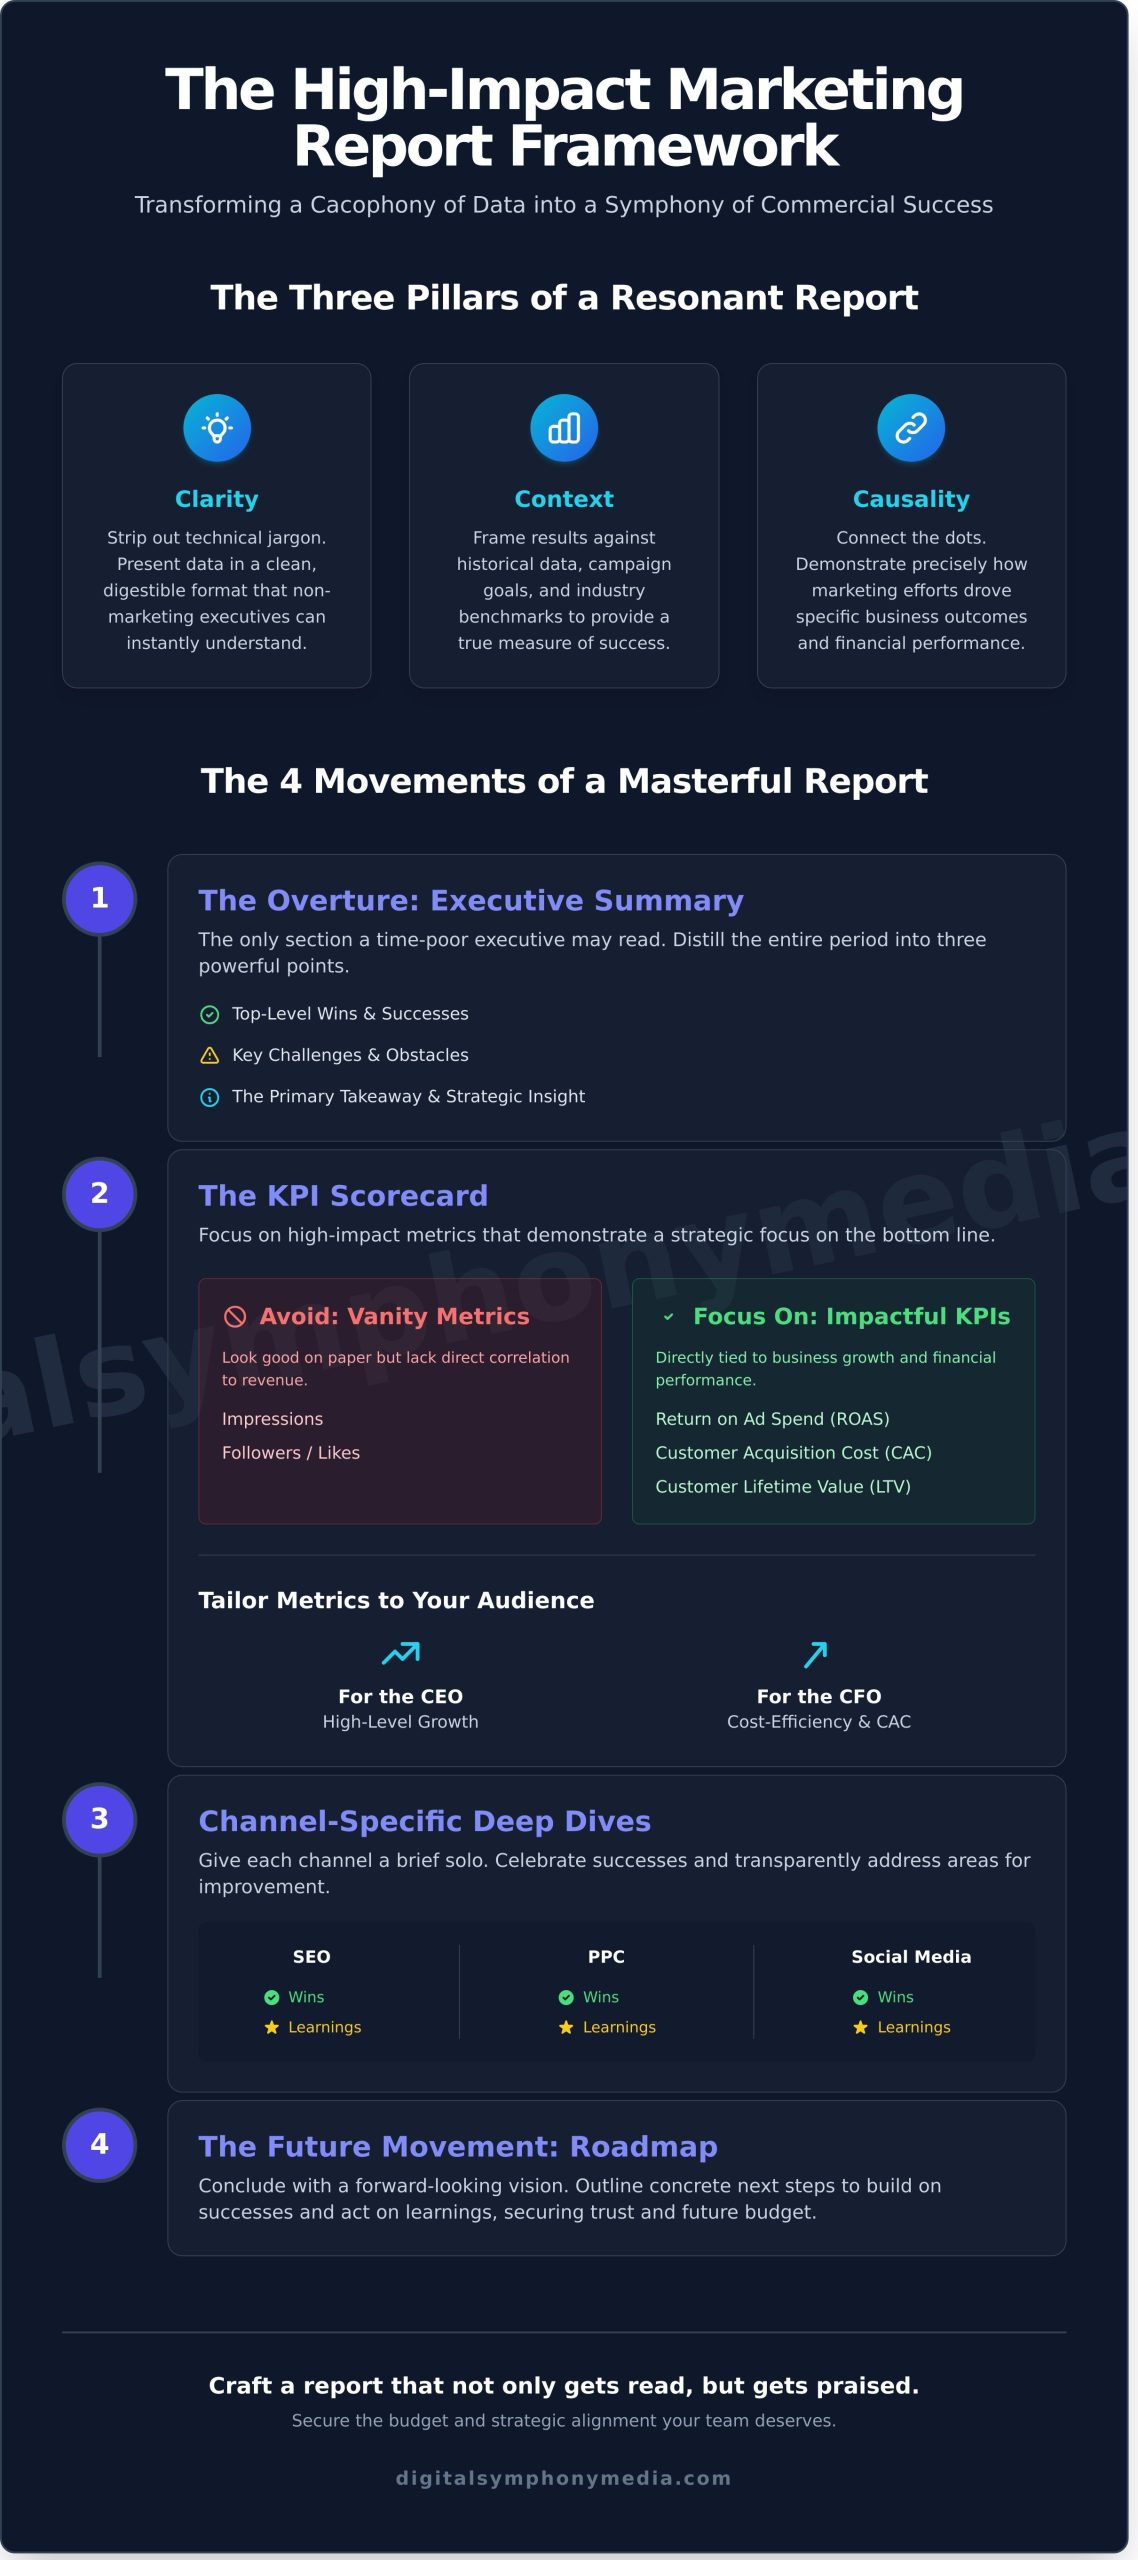
The Three Pillars of a High-Impact Report
To ensure your report resonates with every member of your audience, from the CFO to the Head of Sales, it must be built on three foundational pillars:
- Clarity: We believe in clarity over confusion. This means stripping out the technical jargon that alienates non-marketing executives and presenting data in a clean, digestible format.
- Context: Performance exists in a landscape, not a vacuum. Your report must frame current results against historical data, campaign goals, and relevant UK industry benchmarks to provide a true measure of success.
- Causality: This is the most critical pillar. You must connect the dots, demonstrating precisely how your marketing efforts drove specific business outcomes. Formal frameworks, such as the Marketing Metric Audit Protocol (MMAP), exist to help standardise the process of linking marketing activities directly to financial performance.
Common Reporting Pitfalls to Avoid in 2026
Even the most skilled marketers can fall into common traps that undermine their report’s impact. Orchestrating a successful presentation means actively avoiding these dissonant notes:
- The ‘Vanity Metric’ Trap: Focusing on metrics like ‘Impressions’ or ‘Followers’ can create a lot of noise that drowns out the sound of actual ‘Conversions’. A vanity metric is a data point that looks good on paper but lacks a direct correlation to business revenue.
- Over-reporting: In a world of information overload, more is not better. A 50-page report filled with every available data point will overwhelm busy stakeholders. A focused, strategic summary is always more powerful.
Orchestrating Your Data: Essential Components of the Stakeholder Template
A powerful report doesn’t just present data; it orchestrates it into a compelling narrative of progress and potential. Stakeholders need more than raw numbers-they need a clear story that connects marketing efforts to business growth. Our marketing report for stakeholders template is designed to transform complex data into a clear, confident, and convincing performance review.
Every masterful symphony has distinct movements, and your report should be no different. We structure our reports around four crucial sections:
- The Executive Summary (The Overture): This is your opening statement. For time-poor executives, this is often the only section they read. Distil the entire month’s performance into three impactful bullet points covering top-level wins, key challenges, and the primary takeaway.
- The KPI Scorecard: Move beyond vanity metrics. This section focuses on the high-impact numbers that resonate with the board. Highlighting the right metrics is crucial, and understanding the essential marketing KPIs for your business-such as Customer Acquisition Cost (CPA), Return on Ad Spend (ROAS), and Lifetime Value (LTV)-demonstrates a strategic focus on the bottom line.
- Channel-Specific Deep Dives: Here, each marketing channel (SEO, PPC, Social Media) gets a brief solo. We use a simple ‘Wins’ and ‘Learnings’ format. This approach celebrates successes while transparently addressing areas for improvement, building trust and showcasing a commitment to agile strategy.
- The Roadmap (The Future Movement): Conclude with a forward-looking vision. Outline the concrete next steps you will take to build on wins and address learnings. This shows initiative and reinforces your role as a strategic partner driving future growth.
Visualising the Results: Charts That Tell the Truth
Data visualisation turns numbers into a story. Use trend lines to illustrate growth over time, pie charts to show budget allocation, and bar charts for channel-by-channel comparisons. We integrate a simple ‘traffic light’ system (Red/Amber/Green) against targets for instant comprehension. To give the data a human voice, embed powerful customer testimonials or case study snippets that bring the impact of your work to life.
The Financial Harmony: Linking Spend to Revenue
This is where you prove the value of every pound spent. Briefly explain your attribution model to show how different channels work in harmony to guide the customer journey. Calculate a clear ROI, especially for your UK-based campaigns (e.g., “Our £5,000 PPC investment generated £25,000 in direct sales”). This allows you to justify budget allocation based on a cohesive performance symphony, not as a request for disconnected silos.
Tailoring the Performance: Reporting for Different Stakeholder Audiences
A marketing report is not a monologue; it’s a strategic conversation. A single, static document rarely resonates with everyone because each stakeholder is attuned to a different business frequency. True value lies in tailoring the narrative, a cornerstone of effective stakeholder engagement that turns data into a compelling story of progress. A versatile marketing report for stakeholders template allows you to orchestrate these different views seamlessly.
Consider the distinct perspectives within your leadership team:
- The CEO’s Perspective: The conductor of the entire orchestra wants the grand overview. Focus on high-level growth trajectories, market share, and how marketing amplifies the brand’s voice. They care about strategic position and long-term vision, not the minutiae of every campaign.
- The CFO’s Perspective: The CFO scrutinises the budget and the bottom line. Their report must speak the language of finance: Customer Acquisition Cost (CAC), Return on Investment (ROI), and the direct impact of marketing spend (in £) on revenue. Every note must justify its cost.
- The Head of Sales’ Perspective: This relationship is about harmony. They need to see how marketing efforts translate into tangible opportunities. Highlight lead quality (MQLs vs. SQLs), conversion rates, and data that proves the marketing and sales teams are performing in perfect concert to close deals.
The Executive Summary Cheat Sheet
Your CEO is time-poor. Draft a CEO-ready summary under 100 words that gets straight to the point. Ditch the tactical tasks (“we posted 12 times on social media”) and spotlight strategic wins (“we captured a 15% increase in share of voice within our target demographic”). This is about demonstrating momentum and vision. To see how we orchestrate reporting for our partners, Book a Free SEO Strategy Session.
Storytelling with Data: The Narrative Arc
Even challenging data can be presented constructively. Instead of hiding “bad news,” frame it as a narrative of strategic adaptation. This approach builds trust and showcases your team’s agility. Use a simple arc for your marketing report for stakeholders template:
- The Challenge: What obstacle did we face? (e.g., “A new competitor in the Manchester market increased ad spend, driving up our CPC by 25%.”)
- The Action: What strategic move did we orchestrate? (e.g., “We reallocated budget towards a targeted organic SEO and content strategy focused on long-tail keywords.”)
- The Result: What was the outcome and our learning? (e.g., “This generated higher-intent traffic, improving our lead quality and reducing our overall CAC by 10% for the quarter.”)
The 2026 Marketing Report Framework: A Step-by-Step Implementation Guide
Transforming raw data into a compelling narrative for stakeholders is an art form. It requires more than just numbers; it demands a strategic framework that aligns marketing efforts with business objectives. This five-step process is your roadmap to orchestrating a report that not only informs but also inspires confidence and drives decisive action.
- Step 1: Audit Your Data Sources. Before a single note is played, the instruments must be in tune. Verify the accuracy and integrity of your core data platforms like GA4, your CRM, and Google Search Console. Clean data is the foundation of credible reporting.
- Step 2: Define Your ‘North Star’ Metric. What is the single most critical measure of success that aligns with your company’s current vision? Whether it’s Customer Lifetime Value (CLV), Marketing Qualified Leads (MQLs), or brand search volume, this metric becomes the central theme of your report.
- Step 3: Select Your Template. A powerful performance needs the right stage. Choose a marketing report for stakeholders template that offers both visual impact through clear dashboards and the narrative depth to explain the ‘why’ behind the data.
- Step 4: Automate Data Collection. Your time is best spent on strategic analysis, not manual data entry. Use reporting tools to automate the flow of information, freeing you to focus on uncovering insights and crafting the story.
- Step 5: Schedule a 15-Minute ‘Walkthrough’. Don’t just email the report. A brief, scheduled walkthrough allows you to guide the narrative, answer questions directly, and transform a static document into a dynamic conversation about future growth.
Tools to Orchestrate Your Reporting
Choosing the right platform is crucial for creating a symphony of insights. Looker Studio offers excellent flexibility and integration with Google products, while Power BI excels in enterprise environments. For a truly cohesive view, tools must integrate SEO and PPC data seamlessly. We advocate for a hybrid approach: ‘real-time’ dashboards for operational agility and polished ‘monthly’ deep-dives for strategic stakeholder reviews.
Local Benchmarking for Essex and London Businesses
Global metrics mean little without local context. Comparing your Chelmsford SEO performance against a local competitor provides far more actionable insight than a national average. Understanding UK-specific seasonal trends, such as the impact of Bank Holidays on PPC spend, is vital. We help you measure how your brand’s ‘voice’ is resonating in specific territories, ensuring your marketing strategy is in perfect harmony with the local market.
Orchestrating this level of reporting requires expertise. Discover how Digital Symphony Media can become your strategic partner in growth.
Beyond the Template: How Digital Symphony Media Orchestrates Your Success
A powerful marketing report for stakeholders template is like a piece of sheet music-it provides the notes, structure, and potential for a beautiful performance. But without a master conductor to interpret the data, guide the instruments, and shape the dynamics, it remains just ink on a page. True success isn’t found in the document itself, but in the strategic expertise that brings it to life.
At Digital Symphony Media, we don’t just send reports; we deliver strategic roadmaps. We transform raw data into a clear narrative of performance, opportunity, and sustainable growth. With 75 years of combined experience in SEO, PPC, and Web Design, our team acts as the conductor for your brand’s digital presence. We help ambitious UK brands find their voice, cut through the noise, and amplify their impact through clear, measurable success.
From Reports to Relationships: The Strategic Partnership
We believe in relationships over transactions. A report is a milestone, not the destination. It’s a tool we use to deepen our partnership, align on goals, and collaboratively drive your brand forward. This approach is how our reporting and subsequent strategy led to an impressive 145% increase in qualified lead generation for a Chelmsford-based client. We are your strategic partner, dedicated to shaping trends within your industry rather than simply following them.
Ready to Orchestrate Your Evolution?
If you’re ready to move beyond static reports and embrace a dynamic strategy, we invite you to a bespoke strategy session. We’ll discuss how we customise every aspect of our reporting and strategy-far beyond a generic marketing report for stakeholders template-to fit your unique business objectives and stakeholder needs. Let’s compose a masterpiece of marketing performance together.
Let’s build the future of your brand, together.
From Data Points to a Standing Ovation: Your Reporting Finale
Your journey through this guide has revealed a core truth: effective stakeholder communication is an art form. It’s about transforming raw data into a compelling narrative of progress and potential, tailoring your performance for every audience. Ultimately, the right marketing report for stakeholders template is not just a document; it’s the conductor’s baton you use to direct attention, demonstrate value, and secure buy-in for your strategic vision.
But the sheet music is only the beginning. To create a true symphony of growth requires a master conductor. At Digital Symphony Media, our dedicated Essex-based strategic partners bring over 25 years of agency experience to the stage. With a proven track record of orchestrating Page 1 Google listings, we don’t just report on success-we create it. It’s time to move beyond the template and into a partnership that drives measurable results.
Request Your Bespoke Marketing Strategy & Reporting Roadmap today, and let’s work in harmony to turn your marketing data into your greatest asset.
Frequently Asked Questions
What should be included in a marketing report for stakeholders?
A stakeholder report should orchestrate key performance indicators (KPIs) that align directly with overarching business objectives. Include a concise executive summary, progress against strategic goals, and a clear return on investment (ROI) analysis. Focus on top-line metrics like Customer Acquisition Cost (CAC), marketing-attributed revenue, and market share growth. This ensures the report speaks the language of business impact, not just tactical performance, creating a harmonious narrative of success.
How often should I present a marketing report to the board?
The ideal cadence for presenting to the board is typically quarterly. This rhythm aligns with most financial reporting cycles and allows enough time to demonstrate meaningful progress and strategic shifts. For faster-moving businesses or during critical campaign periods, a monthly summary might be more appropriate. The key is to establish a consistent tempo that keeps marketing in harmony with the board’s strategic oversight, reinforcing your role as a key growth partner.
How do I explain a drop in marketing performance to stakeholders?
Address a performance drop with the confidence of a seasoned conductor. Present the data transparently, providing clear context-such as market seasonality, competitor actions in the UK market, or a strategic pivot. Crucially, follow this with a proactive roadmap for recovery. Detail the insights gained and the specific adjustments you are orchestrating to get back on track. This transforms a potential negative into a demonstration of strategic agility and leadership.
What is the best format for a marketing report in 2026?
Looking ahead to 2026, the most effective format is a dynamic, interactive dashboard, moving beyond the static PDF. Tools like Looker Studio or Tableau allow stakeholders to explore the data that matters most to them, creating a more engaging and personalised experience. This visionary approach transforms your report into a live symphony of marketing performance, showcasing transparency and providing a forward-thinking view of your strategic impact on the business.
How can I make my marketing report more visually appealing without losing depth?
To create visual harmony, focus on clean data visualisation that tells a clear story-a line chart for trends, a bar chart for comparisons. Incorporate your brand’s colour palette and typography for a professional, cohesive look. Structure the report with a strong narrative flow, using concise headlines and annotations to guide the reader. This ensures your report is not just a collection of data, but a compelling visual story of strategic success.
What is the difference between a tactical report and a stakeholder report?
A tactical report details the “how” and “what” of marketing activities, covering metrics like click-through rates and social media engagement. In contrast, a stakeholder report orchestrates the “why” and “so what.” It translates tactical results into strategic business impact, focusing on revenue, market share, and ROI. Think of it as the difference between showing the sheet music and conducting the symphony; one details the notes, the other presents the performance.
How do I measure the ROI of brand awareness in a stakeholder report?
Measuring brand awareness ROI requires connecting top-of-funnel activities to bottom-line results. Use proxy metrics such as increases in branded search volume, direct website traffic, and share of voice. Correlate these uplifts with trends in lead generation and sales over time. For example, show how a 20% increase in share of voice after a PR campaign corresponded with a 10% rise in inbound leads, demonstrating how amplifying your brand’s voice drives measurable success.
Can I automate my stakeholder marketing reports?
Yes, you can and should automate the data-pulling aspect of your reports using dashboarding tools. However, a truly effective marketing report for stakeholders template requires a human touch. The automated data provides the instruments; your role as a strategic partner is to orchestrate them. Always add a layer of manual analysis, key insights, and forward-looking recommendations to provide the strategic narrative that automation alone cannot deliver.